


When developing a new solution for network analysis and monitoring, choosing the right hardware configuration is a one of the main keys of your solution success. Specially in an OT network where incorporating a defective device may be a reason to block multiple important and sensitive industrial machines that may cause production loss. To evaluate a device hardware capacity within an OT network, we have to evaluate its resources such as CPU and Memory response to traffic increase as well as the capacity to support data analysis tools that may be implemented as part of the final solution. These comparisons between the resources that a device may offer and the traffic are essential metrics to evaluate a hardware capacity before using it for OT solutions that will be introduced into a fully functioning ICS environment network.
Introduction
To measure a hardware capacity, we need to prepare a complete testing environment that can monitor the state of the device’s resources and the traffic size that it is handling. We also need to use tools capable of channeling a variety of traffic sizes and intensity to better control the traffic in the network.
Within this paper we will introduce and explain a variety of simple and easy to use tools that can be used for hardware testing purposes in chapter 1. In chapter 2 we will present the testing environment we did set up for this testing objective. Finally, we will present the results of our experiment using the previously mentioned testing environment.
Tools for hardware evaluation
Within this chapter we will present a variety of tools that can be used for evaluating the hardware response toward a variety of network traffic patterns.
Tcpreplay as a tool for generating traffic
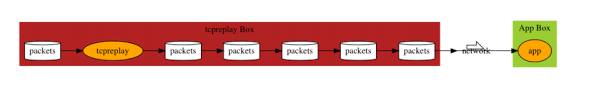
Tcpreplay is a suite of free Open-Source utilities for editing and replaying previously captured network traffic. Originally designed to replay malicious traffic patterns to Intrusion Detection/Prevention Systems, it has seen many evolutions including capabilities to replay to web servers. tcpreplay reads packet capture and plays them back over the network. When the packet capture is done, it starts from the beginning again. Here are some tricks/ideas you can use to make tcpreplay send traffic as fast as you wanted:
- Make sure you are running the latest stable release of tcpreplay.
- Try installing –netmap network drivers and using the – netmap option.
- Use –preload-pcap to load the pcap file into RAM before sending.
- Try a different timing mechanism. – timer=gtod or – timer=nano for example. OS X users should always use –timer=abstime.
- Use –mbps in favor of –pps option.
- If you use –pps also use –pps-multi=X to cause tcpreplay send multiple packets each sleep cycle
- Use –topspeed or –mbps=0. This is always the fastest way to send packets.
Often using a combination of the above options will allow you to reach the speeds you are trying to hit.
To manage the size of the traffic that would be sent through the network, use the –loop option to increase the number of packets to send.
To control the link bandwidth that the traffic will be sent through, use the option -M with the Mbs value you want your link to have.
Through a combination between the –loop and the -M options, you can easily control the number of packets as well as the bandwidth in your simulation. B. Htop as a tool for monitoring resources
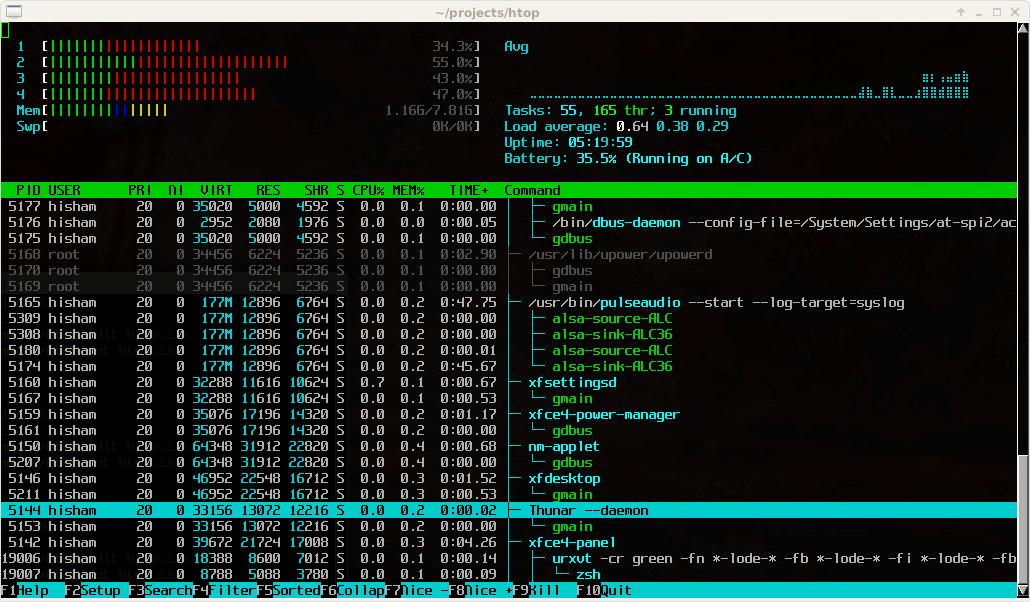
Htop is an interactive system-monitor process-viewer and process-manager. It is designed as an alternative to the Unix program top. It shows a frequently updated list of the processes running on a computer, normally ordered by the amount of CPU usage. Unlike top, htop provides a full list of processes running, instead of the top resource-consuming processes. htop uses color and gives visual information about processor, swap, and memory status. Htop can also display the processes as a tree. Htop shows the percentage of CPU usage as well as the Memory use of the system. Using this tool in the targeted hardware will show in real time the state of the Hardware concerning available resources and saturation.
Iftop as a traffic monitoring tool
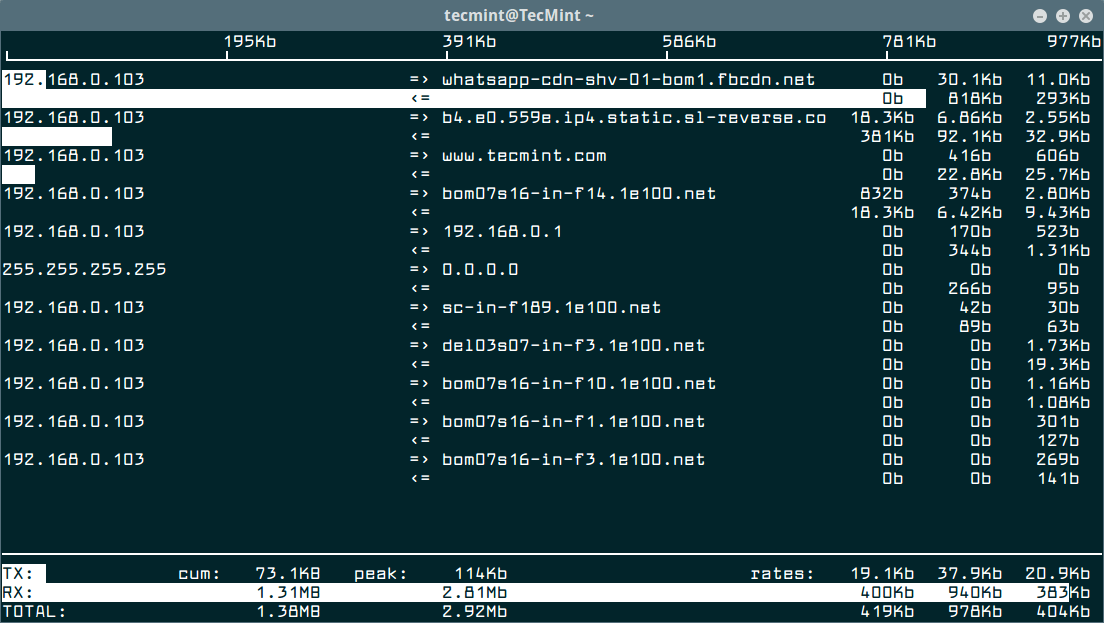
Iftop is a free software command-line system monitor tool that produces a frequently updated list of networks connections. By default, the connections are ordered by bandwidth usage, with only the “top”
bandwidth consumers shown. This tool allows you to see multiple indicators related to the TX and RX of the device. TX and RX are abbreviations for Transmit and Receive, respectively. These indicators include the cumulative bandwidth usage and the peak bandwidth usage for both TX and RX.
Elasticsearch as a tool for data management
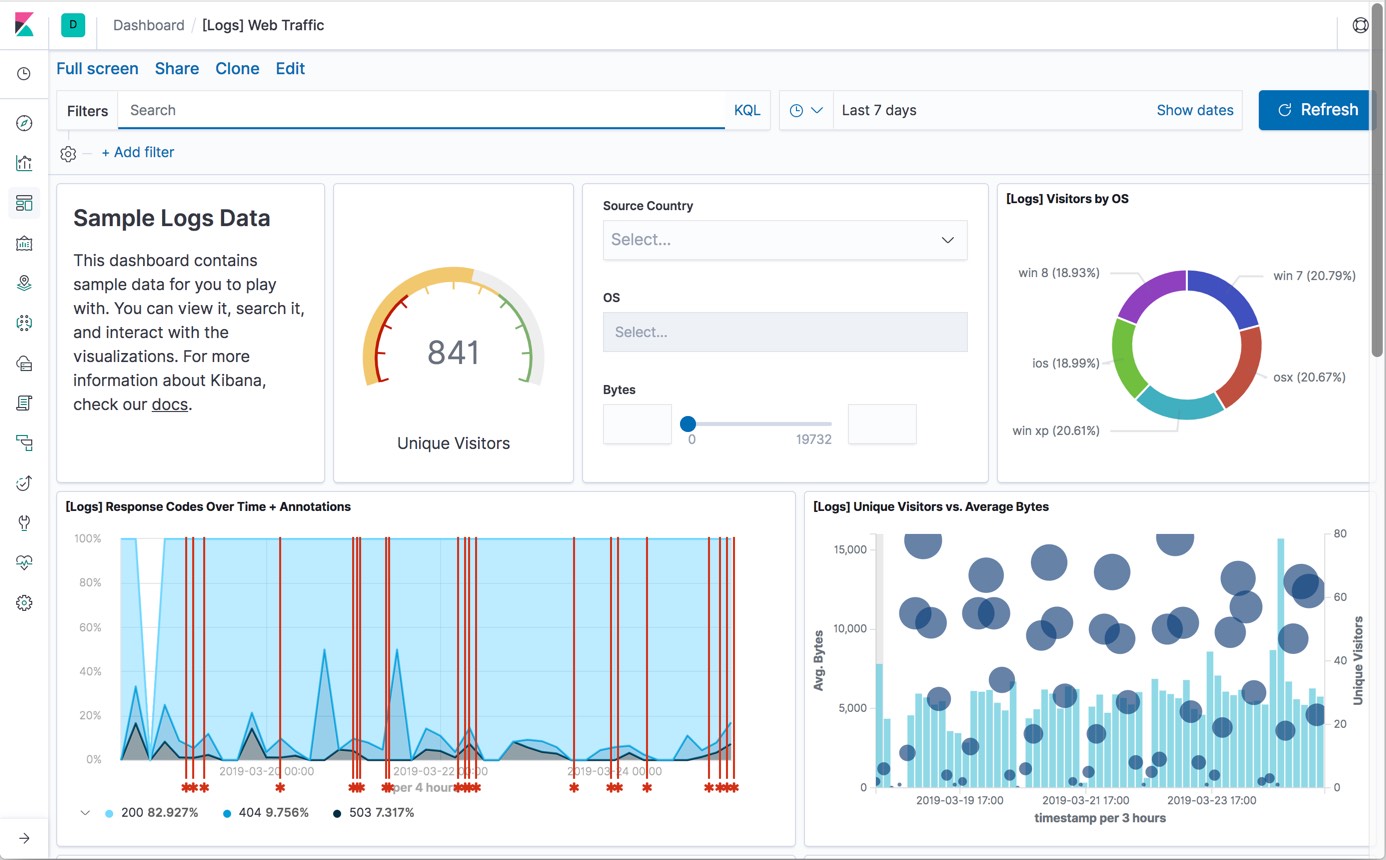
Elasticsearch is a search engine based on the Lucene library. It provides a distributed, multi-tenant capable full-text search engine with an HTTP web interface and schema-free JSON documents. Elasticsearch is developed in Java and is dual-licensed under the source-available Server-Side Public License and the Elastic license while other parts fall under the proprietary (source-available) Elastic License.
Official clients are available in Java, .NET (C), PHP, Python, Apache Groovy, Ruby and many other languages. According to the DB-Engines ranking, Elasticsearch is the most popular enterprise search engine followed by Apache Solr, also based on Lucene.
In this work Elasticsearch will be responsible for saving packets data and searching through it. It would be used as an indicator of the hardware capacity to serve an application that require resources incrementing based on the received traffic.
Experience and results
Experience
Using an industrial device as a testing subject, we prepared the following experience:
- The tested hardware description:
- CPU: INTEL i5 5200u 2.2GHZ 5th generation with 5200u processor (Dual Core / 4 threads).
- RAM: 16Gb
- Network connectors: 2 RJ45 network cards
- The tested software:
- An Elasticsearch engine responsible of saving data into the device.
- A Tshark module responsible for collecting data from network ports and sending it to the Elasticsearch.
- The tested architecture: We connected the targeted device to a mirroring port of the main switch in the network. We also connected another industrial PC to the same switch. The second industrial PC was the one in charge of generating traffic in the network. Through this configuration when the traffic was being generated in the network, the tested device was receiving it and saving it into the Elasticsearch device.
- Traffic generated: Using the tcpreplay tool with a PCAP collected from an industrial network, we generated traffic into the testing network with a variety of intensity and bandwidth. The PCAP used contained multiple packets of Modbus and s7comm protocols to control and manage a PLC s71200 in an ICS environment.
Results
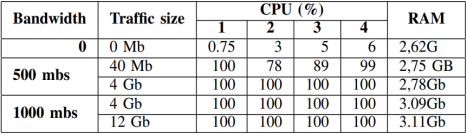
The following table show the effect of traffic size and bandwidth over the hardware resources using the htop tool. As we can see in the table 1, the CPU is the resource most needed when it comes to network analysis.
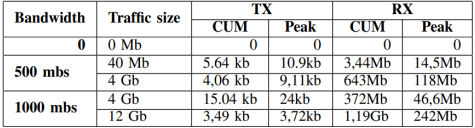
Table 2 shows that with the increase of network traffic both the TX and the RX values increased in the tested device. Monitoring the state of the elasticsearch, we noticed that with 4Gb of traffic and 500 MBs of bandwidth the Elasticsearch system started to show a delay, but as soon as we increased the bandwidth, the Elasticsearch completely stopped working.
TRAFFIC SIZE CHANGE
AND TRAFFIC SIZE CHANGE
Conclusion
In this paper, we presented several tools that can be used for evaluating the effect of the network traffic on the hardware resources. The CPU seems to be the most valuable resources when it comes to traffic analysis.